- Posted By: namita
- Comments: 0
Posted By namita on July 5, 2017


Laboratory Management System Data flow diagram is often used as a preliminary step to create an overview of the Laboratory without going into great detail, which can later be elaborated.it normally consists of overall application dataflow and processes of the Laboratory process. It contains all of the userflow and their entities such all the flow of Student, Lab, Report, Update, View, Complete Information, Login. All of the below diagrams has been used for the visualization of data processing and structured design of the Laboratory process and working flow.
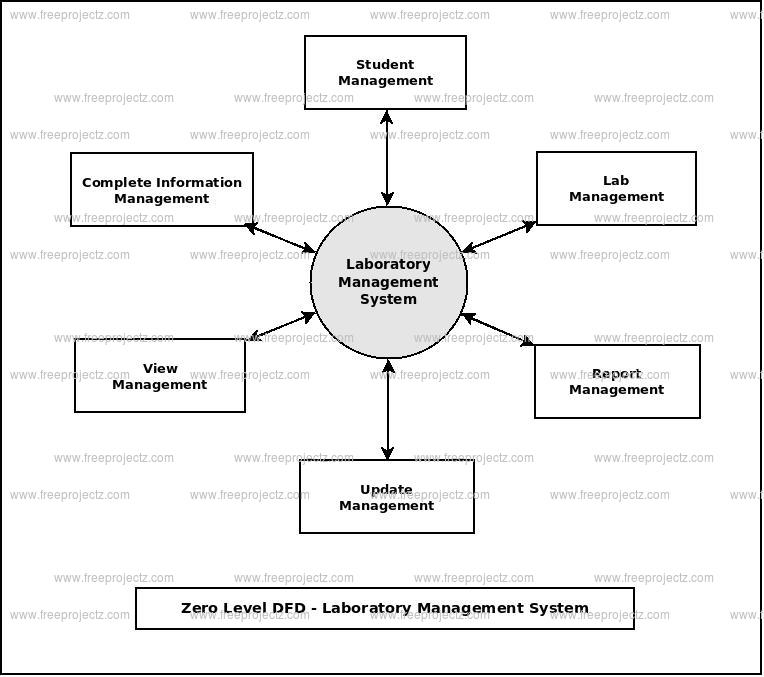
Zero Level Data flow Diagram(0 Level DFD) of Laboratory Management System :
This is the Zero Level DFD of Laboratory Management System, where we have eloborated the high level process of Laboratory. It’s a basic overview of the whole Laboratory Management System or process being analyzed or modeled. It’s designed to be an at-a-glance view of View,Complete Information and Login showing the system as a single high-level process, with its relationship to external entities of Student,Lab and Report. It should be easily understood by a wide audience, including Student,Report and View In zero leve DFD of Laboratory Management System, we have described the high level flow of the Laboratory system.High Level Entities and proccess flow of Laboratory Management System:
- Managing all the Student
- Managing all the Lab
- Managing all the Report
- Managing all the Update
- Managing all the View
- Managing all the Complete Information
- Managing all the Login

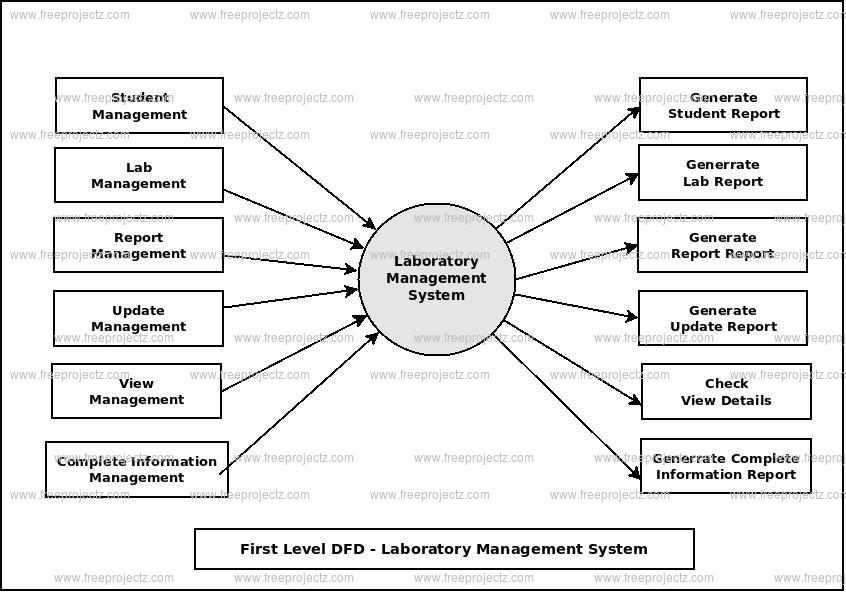
First Level Data flow Diagram(1st Level DFD) of Laboratory Management System :
First Level DFD (1st Level) of Laboratory Management System shows how the system is divided into sub-systems (processes), each of which deals with one or more of the data flows to or from an external agent, and which together provide all of the functionality of the Laboratory Management System system as a whole. It also identifies internal data stores of Login, Complete Information, View, Update, Report that must be present in order for the Laboratory system to do its job, and shows the flow of data between the various parts of Student, Report, Complete Information, Login, View of the system. DFD Level 1 provides a more detailed breakout of pieces of the 1st level DFD. You will highlight the main functionalities of Laboratory.Main entities and output of First Level DFD (1st Level DFD):
- Processing Student records and generate report of all Student
- Processing Lab records and generate report of all Lab
- Processing Report records and generate report of all Report
- Processing Update records and generate report of all Update
- Processing View records and generate report of all View
- Processing Complete Information records and generate report of all Complete Information
- Processing Login records and generate report of all Login

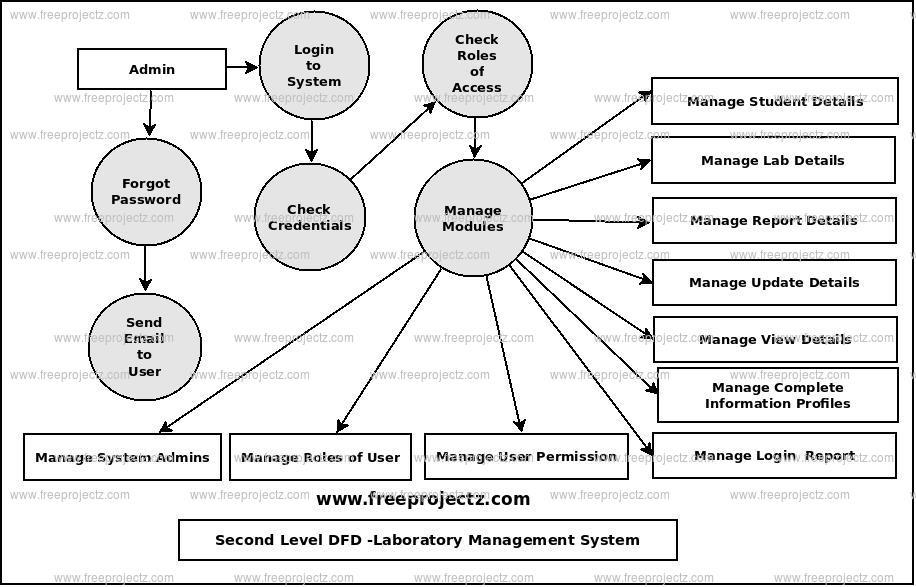
Second Level Data flow Diagram(2nd Level DFD) of Laboratory Management System :
DFD Level 2 then goes one step deeper into parts of Level 1 of Laboratory. It may require more functionalities of Laboratory to reach the necessary level of detail about the Laboratory functioning. First Level DFD (1st Level) of Laboratory Management System shows how the system is divided into sub-systems (processes). The 2nd Level DFD contains more details of Login, Complete Information, View, Update, Report, Lab, Student.Low level functionalities of Laboratory Management System
- Admin logins to the system and manage all the functionalities of Laboratory Management System
- Admin can add, edit, delete and view the records of Student, Report, View, Login
- Admin can manage all the details of Lab, Update, Complete Information
- Admin can also generate reports of Student, Lab, Report, Update, View, Complete Information
- Admin can search the details of Lab, View, Complete Information
- Admin can apply different level of filters on report of Student, Update, View
- Admin can tracks the detailed information of Lab, Report, Update, , View


