- Posted By: freeproject
- Comments: 0
This is the Activity UML diagram of Finance Management System which shows the flows between the activity of Interest, Losss, Loaner, Profit, Share Holders. The main activity involved in this UML Activity Diagram of Finance Management System are as follows:
- Interest Activity
- Losss Activity
- Loaner Activity
- Profit Activity
- Share Holders Activity
Features of the Activity UML diagram of Finance Management System
- Admin User can search Interest, view description of a selected Interest, add Interest, update Interest and delete Interest.
- Its shows the activity flow of editing, adding and updating of Losss
- User will be able to search and generate report of Loaner, Profit, Share Holders
- All objects such as ( Interest, Losss, Share Holders) are interlinked
- Its shows the full description and flow of Interest, Profit, Share Holders, Loaner, Losss

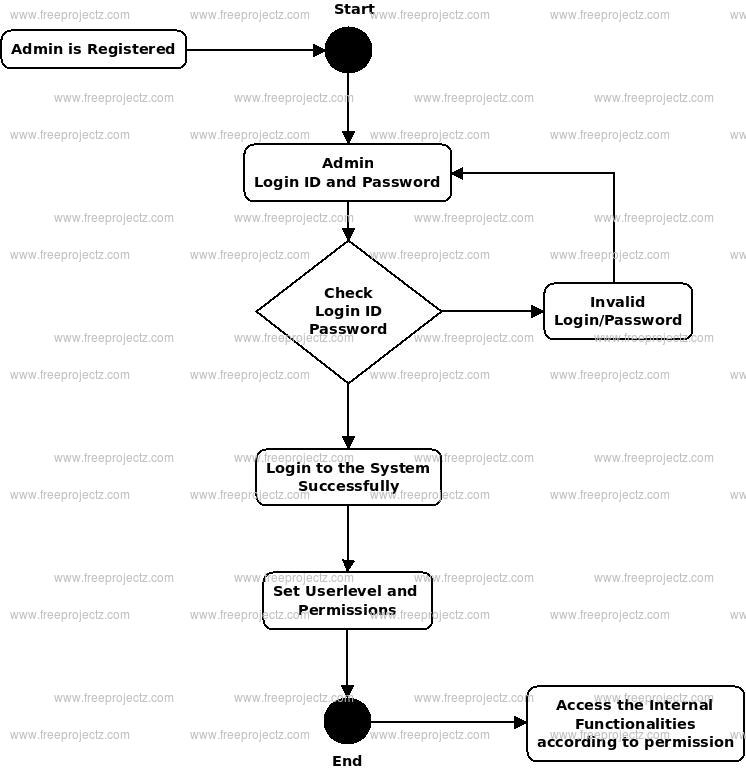
Login Activity Diagram of Finance Management System:
This is the Login Activity Diagram of Finance Management System, which shows the flows of Login Activity, where admin will be able to login using their username and password. After login user can manage all the operations on Loaner, Interest, Losss, Share Holders, Profit. All the pages such as Losss, Share Holders, Profit are secure and user can access these page after login. The diagram below helps demonstrate how the login page works in a Finance Management System. The various objects in the Share Holders, Loaner, Interest, Losss, and Profit page—interact over the course of the Activity, and user will not be able to access this page without verifying their identity.


